QGIS
I looked for a spatial data browser and found GeoApt Spatial Data Browser. I got interested in adding to it, so I started looking at its internals. I became more curious about QGIS.
Learn by doing
I am keeping my projects in Documents/Projects/ for now. There are some in Dropbox/Projects too.
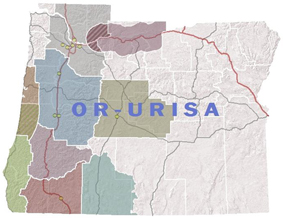
ORURISA sections map
In Documents/Projects/ORURISA/
I will put generic data in Documents/GIS/Data_Repository/

I need a basemap with hillshades and highways, perhaps from ESRI Living Atlas. How to
I was getting a 499 error, which I think means I need to log in first on
ESRI?
I want to use this one. It says I need an account in the metadata. https://www.arcgis.com/home/item.html?id=c3587bd89d474dff8d306fefdc295083
QGIS configuration and options
I was getting a missing font message today. There is an option to automatically download fonts. Why does it not work? (Spoiler: it's a bug.)
You can see it by going to Settings->Options->Fonts.
I could manually download and install here but I want the automatic feature to work! It seems cool. The error message is "Error transferring https://github.com/google/fonts/raw/main/ofl/opensans/OpenSans[wdth,wght].ttf - server replied: Not Found"
I dug around and found it nearby. This works https://github.com/google/fonts/raw/refs/heads/main/ofl/opensans/OpenSans%5Bwdth,wght%5D.ttf
Not sure how knowing this helps. The answer seems to be "wait for the next release of QGIS, it's a bug because Google removed the download link." I turned off the option to stop seeing the error on startup.
Manually? I would unpack the font(s) to ~/.local/share/QGIS/QGIS3 somewhere... in profiles/ ? What is a profile? I got this path looking at font settings
Put your fonts in profiles/default/fonts/ or in some other profile besides "default".
QGIS Profiles
Working with OpenStreetMap
Brian H wants to display a shapefile, and clip part of it out to use in JOSM for uploading to OpenStreetMap.
I think there is an OSM plugin for QGIS but the workflow we came up with is to extract the data you want to add in QGIS, save it in a shapefile, and then start up JOSM and load the shapefile there for upload to OpenStreetMap.
Displaying OSM as a tiled layer in QGIS
I'd like to be able to see what data is already in OpenStreetMap while running QGIS. Both for day to day usage in mapping and for OpenStreetMap projects.
(Thanks Nick)
Save this text into a file with the .xml extension. Variations on this will work for ANY tiled map service, not just OSM. In QGIS, use "Add Raster Layer" and navigate to the file you saved. Voila! A base map.
<GDAL_WMS>
    <Service name="TMS">
        <ServerUrl>http://tile.openstreetmap.org/${z}/${x}/${y}.png</ServerUrl>
    </Service>
    <DataWindow>
        <UpperLeftX>-20037508.34</UpperLeftX>
        <UpperLeftY>20037508.34</UpperLeftY>
        <LowerRightX>20037508.34</LowerRightX>
        <LowerRightY>-20037508.34</LowerRightY>
        <TileLevel>18</TileLevel>
        <TileCountX>1</TileCountX>
        <TileCountY>1</TileCountY>
        <YOrigin>top</YOrigin>
    </DataWindow>
    <Projection>EPSG:900913</Projection>
    <BlockSizeX>256</BlockSizeX>
    <BlockSizeY>256</BlockSizeY>
    <BandsCount>3</BandsCount>
    <Cache />
</GDAL_WMS>
I leave the map in Web Mercator but you can do reprojection on the fly if you want.

Screenshot of Finley NWR area.
Log messages
I did actually find the button for this (see above screenshot) and now I can't find it again. Please tell me what I did. :-) The user manual I found is wrong. :-( Nick mentioned how great it would be to see error messages when trying to load a WMS layer.
Reprojection on the fly
or WHERE'S MY DATA??? I can't see it!
By default, QGIS has reprojection turned off. So if you bring in a layer in web mercator and then bring in a shapefile that is in a different projection, the layers will not line up.
- File->Project Properties (or control-shift-P)
- Coordinate Reference System (CRS) tab
- Check the box "Enable 'on the fly' CRS transformation"
The map should now render all the layers in the right places. QGIS 1.9 is a little buggy, so you might have to do this before adding layers. Not sure. It usually works for me but I sat here working with Nick and it was troublesome.
Adding a shapefile with hydro data
Download the shapefile, for example, for Benton county. http://gis.co.benton.or.us/GISDataDownload/Natural_Features/water.zip Unzip it someplace convenient.
- In QGIS, click on "Add Vector Layer" (icon: a green map with a +)
- Click Browse and find the water.shp file.
- Click Open. If you can't see the layer then try right-clicking the layer in the table of contents and select Zoom To Layer Extent.
- Set the CRS. Properties (double click on the layer name) "General" Click "Specify CRS" and set it to EPSG:2913 NAR83(HARN_ / Oregon North (ft)
- For this particular line layer you might want to use the Properties (double click on the layer name) "Style" tab to make the color blue and make the line a little wider (.36 works for me).
Zoomed into Finley NWR my map looks like this now. I used purple for the water shapefile so it's easier to see.

Extracting data from a layer
Create a shapefile to define region of interest
- Create a new shapefile to define a region of interest. To do so click "New Shapefile Layer" (green map with yellow star)
The new layer will be added to your table of contents.
- As above, set its CRS to EPSG:2913. The CRS settings HAVE TO BE THE SAME for the clip operation to work.
- Select that layer in the table of contents by clicking on it.
- Click on "Toggle editing" (a blue pen) -- the button should stay "depressed".
- Click on "Create new feature" (A polygon with red vertices)
Now you can create a polygon around your area of interest on the map. Left click = add vertex Right click = done. Enter an ID value (I used "1") and then stop editing and save your changes. (Click "Toggle editing" again.)
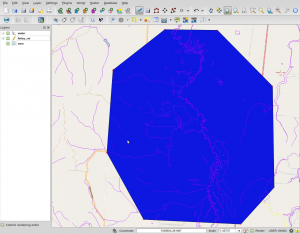
Region of interest shows up in blue on my map.

Clip water features using region of interest
In the "Vector" menu (in the menu toolbar at the top) use Geoprocessing Tools->Clip and select the layers you want to use.
In this example,
- The "Input vector layer" is "water"
- The "Clip layer" is "finley_roi"
- Set the "Output shapefile" as you desire, and
- click ok.
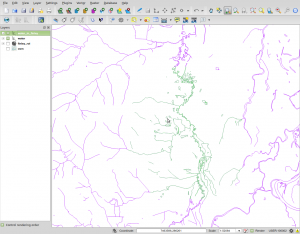
Here I have dragged the water_in_finley to the top of the table of contents, changed it to green, and unchecked OSM layer to make it visible.

Reproject and export
I know you can use a shapefile in JOSM but you can export to many other formats (KML, for example). I need to export to WGS84 (EPSG:4326) too
To export the data (and reproject it),
- Right click on the layer in the table of contents and select "Save As..."
- Set the Format (I choose KML, Brian H leaves it at Shapefile)
- Set the name
- Select the correct CRS (WGS 84)
- Click okay.
and we're done.
Different platforms
QGIS on Windows
I normally just use the standalone version, I don't do a lot of GIS with QGIS on a Windows machine, so I don't need the full OSGEO suite.
QGIS on the Mac
I am hereby officially abandoning the Mac as a GIS machine. It's just too much work when I can run Linux in VirtualBox or Parallels instead. So this becomes instead "Linux on the Mac" and...
QGIS on Linux
I have installed it using flatpak on Mint but still don't see the point of flatpak really.
Today I followed the instructions QGIS provides for Debian/Ubuntu to install version 3.34 on Murre
QGIS in Parallels for Mac
After installing Debian in Parallels, I add repositories for QGIS and then I can just install from packages.
Tips for Linux in a virtual machine:
- If using Parallels then install the KDE version so you can use Coherence. Then disable compositing in the Hardware control panel.
- turn on 2D and 3D acceleration in VirtualBox display settings to get the Linux drivers to work.
- Do this, to fix a warning message in apt: sudo update-locale LANG=en_US.UTF-8
sudo apt-get update
sudo apt-get upgrade
sudo apt-get
Add QGIS:
echo "deb https://qgis.org/debian-nightly stretch main" | sudo tee /etc/apt/sources.list.d/qgis.list

sudo apt-get install qgis
This installs a boat load of related GIS software including GDAL.
Note I have a separate Coastal LiDAR page and there are more notes there on working with Linux + LiDAR
Building QGIS from source
This is an onerous task... I have not succeeded yet. I want to be able to contribute code changes eventually!
First go do this: Building GDAL on Linux (or possibly just go set up a machine as in the previous section, using the latest QGIS installer to get all the dependencies loaded.)
Then do the next steps based on this page: http://www.qgis.org/api/INSTALL.html#toc3
You don't want to overwrite your custom geos or gdal so this is different than the above link indicates. BTW I am building on Linux Mint, not Ubuntu or Debian
I like to break things up into smaller chunks too so I can see what's going on more easily.
# I'd be surprised if you dont already have these
sudo apt-get install xauth xfonts-base
# some general tools and development stuff
sudo apt-get install bison cmake doxygen flex git pkg-config python-dev python-sip python-sip-dev graphviz xvfb txt2tags
sudo apt-get install libfcgi-dev libgsl0-dev libexpat1-dev
# some QT tools
sudo apt-get install libqt4-dev libqt4-opengl-dev libqtwebkit-dev libqwt5-qt4-dev pyqt4-dev-tools python-qt4 python-qt4-dev
# some gis things
sudo apt-get install libspatialindex-dev libspatialite-dev libsqlite3-dev
- left out because depend on gdal
- libosgearth-dev libopenscenegraph-dev